There’s been a lot of talk on the ‘net about monitoring Unifi equipment. Unifi is a brand of prosumer networking equipment from a company called Ubiquiti. If you’ve ever wanted “the good stuff” for your home or office network, make sure to have a look at them, but I digress.
One of the drawbacks of Unifi equipment is that they don’t publish their SNMP MIBs, so if you’re trying to add a Unifi router, switch, access point, etc. into your monitoring system, you’re in for a lot of work as you poke about with “snmpwalk” and see what you find. But, if you run Zabbix as your monitoring system, you’re in luck. Zabbix makes this easy, as they do with many things.
Let’s take the example of a Unifi switch, but this concept works for all of their networking devices I’ve tested.
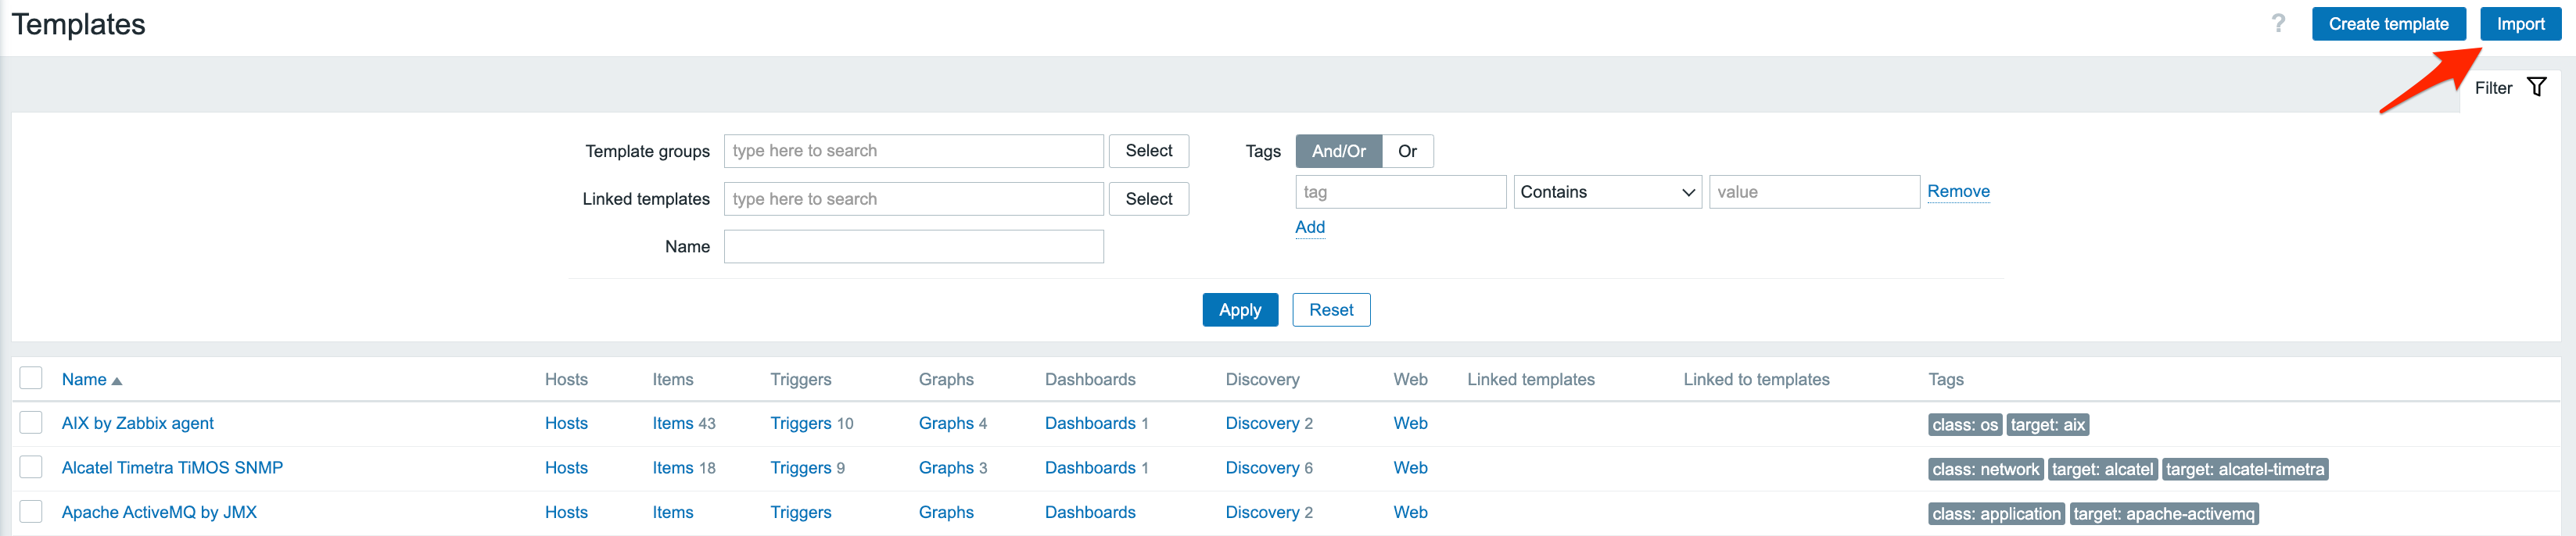
The trick in all of this is the Zabbix Template which does not come pre-installed. To install it you can download it here (for credit, visit the author’s GitHub repository) and unzip it. You’ll find an xml file in the zip, and you’ll want to import it into your Templates. To do this, go into your Templates under the Configuration menu, click on the Import button and follow the directions.
Once you’ve imported the Template, it will be available to add to a Host in Zabbix.
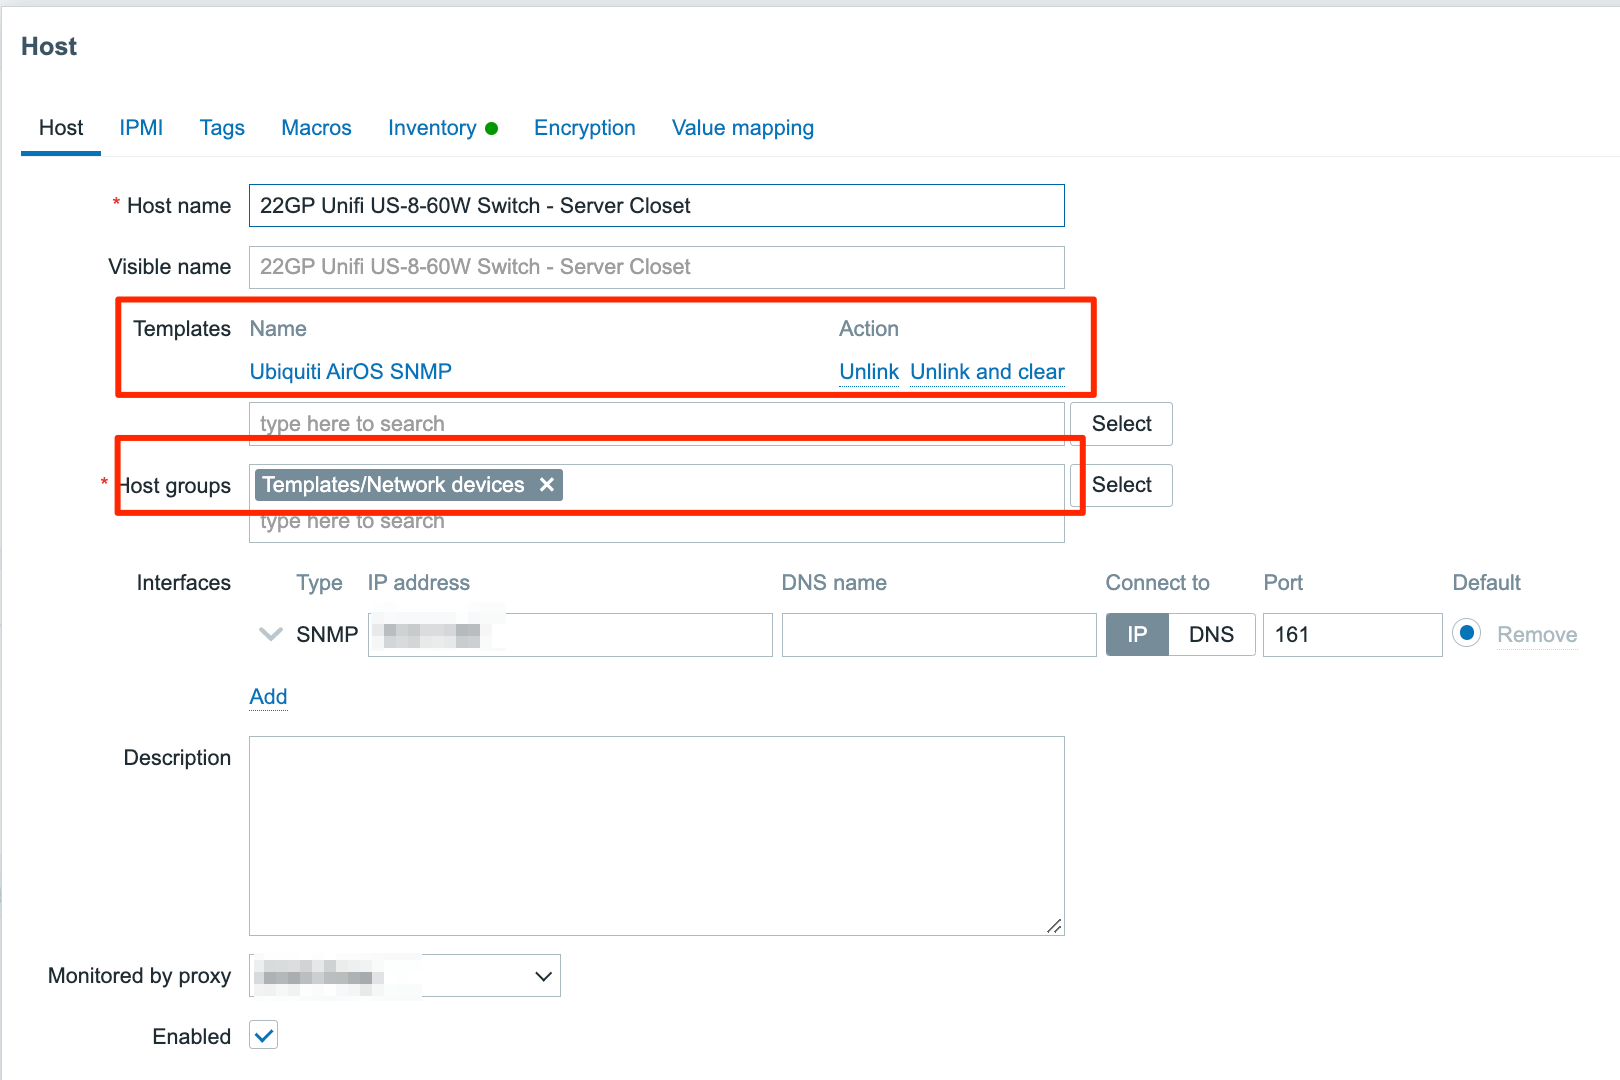
Finally, to monitor the switch, create a Host which looks something like this in the image below. Note I’ve added the “UbiquityAirOS SNMP” Template. I’ve also added an Interface that points to the switch’s network address as SNMP. Since a Zabbix Agent can’t run on a switch, I’ve just used the network address as an SNMP device, so it doesn’t show any errors when looking for a missing Agent. Indeed, Unifi switches are SNMP enabled, so talking on that port won’t produce an error.
Once you’ve created the Host, assigned the correct networking address as SNMP, and added the Template, just wait for the Template to do its magic. Be patient, as it may take a few minutes to sniff out the switch and its settings. When it does, you’ll see lots of Items created and Triggers to go with those Items, meaning you should have to do very little from here on out.
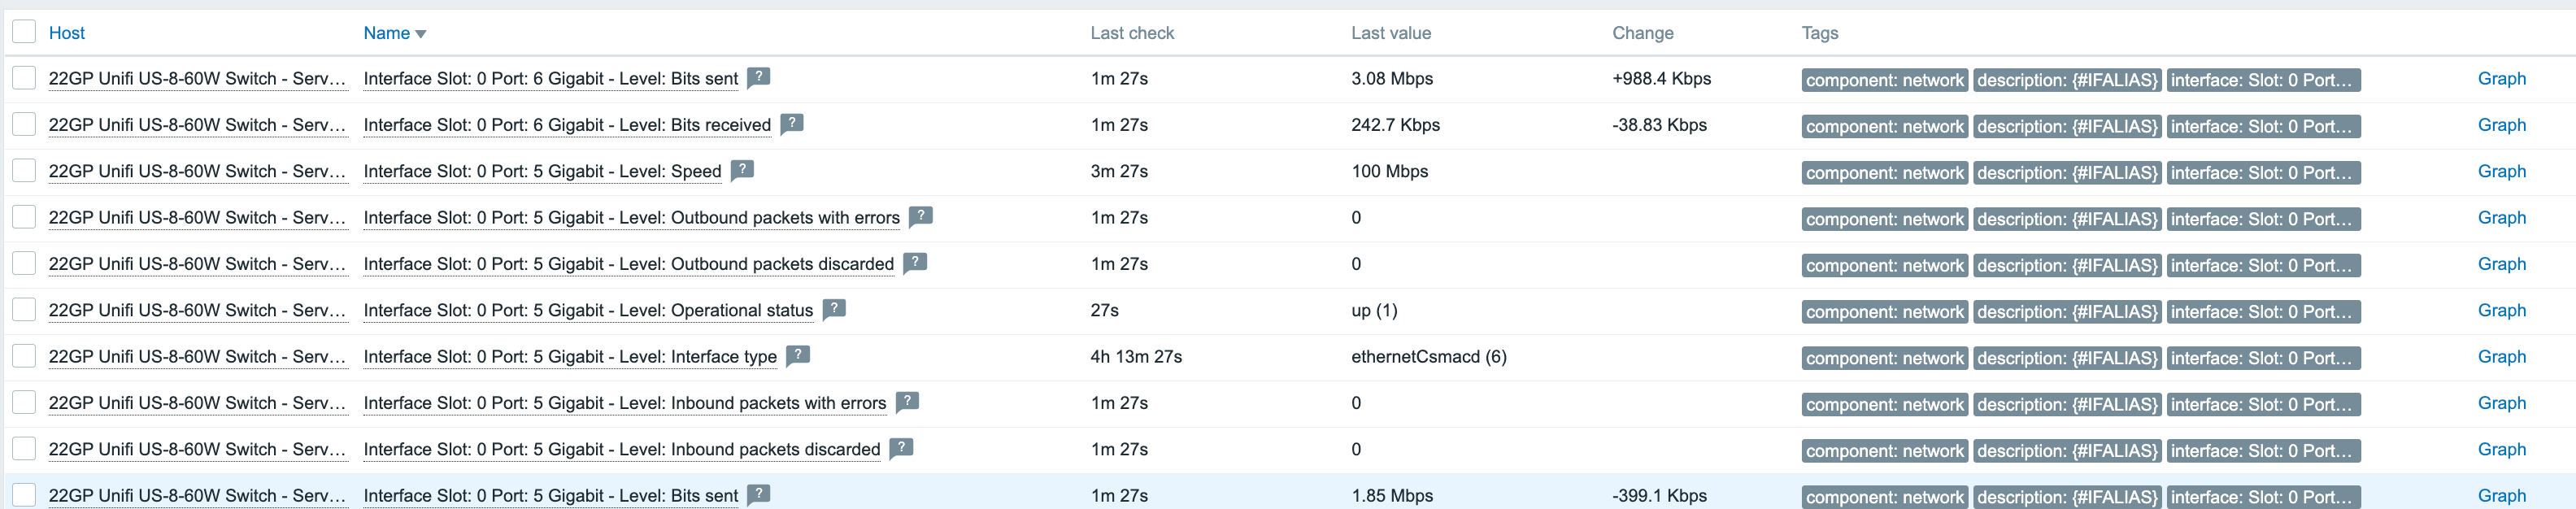
Once the Items start to appear, you can look in the Latest Data menu item under Monitoring and select your switch’s Host. You’ll see lots of data appear that looks a little like the image below. Of course, depending on the model of your switch, different things will be monitored and thus shown in your Zabbix as Latest Data.
Now that it’s up and running a few things to note.
- You may get notices of links (often called a “port”) in the switch going offline sometimes. These are not active ports, but perhaps a port that’s not currently in use, and Zabbix discovered this and alerted you. The first time this is a little alarming, but you soon realize that these ports are not in use, and you can disable them if you’d like.
- If you upgrade the Unifi device and use the same network address, you’ll get a whole new set of data in Zabbix that will mix with the old data. This mixing is probably confusing, so I’d recommend clicking on the “Unlink and Clear” link near the Template, and then adding the Template back into Zabbix. This will clear out the old data and only have the new data showing up.
I tried it, and it worked. Thanks!
hello,
i tryed to use this template for US-16-xg and US-48-500w but on both devices i got error ( No Such Object available on this agent at this OID) for CPU, memory, and other items that are not discoverd by network interface discovery. can you please help me ?
It sounds like SNMP might be turned off on your switch. Can you try checking to see if it’s turned on?
Do you have SNMP turns on at the switch level?
does this also work with UDM PRO?
It should, yes.
I have connected to SNMP, but Latest Data menu item under Monitoring does not display port traffic and data , and the template confirms that it has been set
I’m not sure what is causing this. If you use some other tool to query the SNMP is is reporting the correct data?
thank you for your reply. The monitoring data for the switch port will not appear until 2 hours after the configuration is completed. I also want to ask, I have a port 2, alarm, Interface Slot: 0 Port: 2 10G – Level: Link down, but this port is not in use. And the alarm keeps on going away, how should I configure it?
That’s a long time to wait for the data. Is something else preventing the update?
As for port #2, you can go into the Template and report this port (or better, make a copy of the template, remove it there, and use this copy instead). Other than that, you can make it as ACK for 99 years, but that’s really just a band-aid patch. I’d go with the template.