Author: Dave Strickler

  • Monitor a Mac’s TimeMachine backups

    If your supporting Mac’s in your environment, you probably have come across TimeMachine, Apple’s answer to backups to a local disk or NAS.

    While configuring TimeMachine on a Mac is very easy, and good Admin wants to keep track that these backups are actually being run on a regular basis. The problem with this is that Apple doesn’t give you a way to easily monitor this. But I went digging, and found a way.

    TimeMachine does have a utility installed on the Mac, and you can get some data from it into Zabbix, but it’s not enough to be really useful. If you’re curious, here are the Items I configured. Note I do a little dancing to parse the output of these system.run[] commands, but they should work well on any Mac.

    Note that these commands are being run on the Mac itself, and that Zabbix is running them via the Agent. This works well, but our problem still remains as these functions tell us basic info about the backup, but not the last time that one was really run.

    In order to sense last time TimeMachine was run, we exploit the drive needing attached to the Mac, as when TimeMachine makes a backup, it has to attach to a disk, even if it’s a on the network. All we need to do is check a date stamp on a directory, and you can get an approximate time of the last backup. In Zabbix this means we can use a few variables.

    • {$TIMEMACHINE_BACKUP_PATH} — The path off the root of the disk which should be the same for all your Macs on the network, like /Volumes/TimeMachine_Disk
    • {$MY_BACKUP_PREFIX} — Often times the name if the Mac, like “TOMSMAC”

    … and then use the zbx_mac_timemachine_backups_templates.json template that you can import into Zabbix and then change variable names. Note that while {$TIMEMACHINE_BACKUP_PATH} is probably fine for all your Macs who use the same TimeMachine directory to back up their files, the {$MY_BACKUP_PREFIX} should be configured at the Host level and changed to match the user’s mac’s name.

  • AWS Throttles Its Customers

    I’ve been working with large files for a few years now. These zip files are normally over a gigabyte and can easily go into the 50-100 gigabyte range. They contain data that can only be compressed to about 50%, so there’s no way to make them much smaller – they are what they are.

    These files need to be uploaded from the field and processed in the cloud, and I’ve chosen AWS to do the storage via S3 and the processing via EC2. While we’ve been generally pleased with each, we have seen that AWS throttles data to and from S3 and also the creation of large instances in EC2.

    This means that if I have a 10 gigabyte zip file I need uploaded to EC2, even if I’m using a network-optimized AWS image that supposedly can handle over a gigabit ethernet, my upload speeds are in the 30-70 megabit range. And yes, I’m uploading from a 1 gigabit connection with a cable – not WiFi, and yes, I’ve tested uploading to various resources, and yes, they all upload at about 800 megabits/sec, the reasonable throughput of a 1 gigabit line. The same goes for downloading from S3. My speeds can be in the range of 14-80 megabits/sec.

    You’ll also find that when spinning up a large instance, such as a 64 cores and 192 gigabytes of RAM, AWS often reports back that they are out of capacity in a particular zone. Trying other zones will have the same results. AWS is simply under-provisioned for handling customer needs that are “out of the norm”.

    I do understand that handling multi-gigabyte files is unusual, and so is spinning up an EC2 instance that costs about $100/day, but no where does AWS say “don’t tax our systems because we can’t handle it, and will throttle you”.

    If you have these needs, you have now been warned about AWS.

  • Tuning MySQL’s Innodb for Smaller Sites

    Scour the ‘net for how to reduce your MySQL server footprint, and you won’t find much. Everyone seems to want to beef up its settings, and I’ve been one of them. When you have a server cluster taking thousands of requests per second, the battle cry is often for more RAM to aid in caching data. But for smaller sites, like a neighborhood hiking club, you will have a very different server setup.

    Smaller sites will be run on smaller servers with smaller resources. With a server that’s only got 4GB of RAM, every megabyte matters.

    Like any good household budget trimming exercise, the first thing you want to look for is caching or buffers that may be too large. If you’re running the MySQL Innodb engine, the default cache is 128MB of RAM. While that doesn’t seem like much, if you’re data set size is 32MB, that’s a lot of wasted RAM that can’t be used for anything else. 32MB of data will never fill a 128MB cache.

    While you’ll need to figure out how which you’ll need to allocate, find your config file (usually in /etc/mysql/my.cf) and make sure you have a line like this:

    innodb_buffer_pool_size=32M # Overall size of pool. The default is 128MB
    innodb_buffer_pool_chunk_size = 8M # Default is 128MB

    Then restart MySQL and see how your system performs. Still fast enough? If you’ve removed unneeded cache RAM you shouldn’t see any difference in the speed, and on small sites, caching may not be needed at all.

    Another thing to look for is excessive disk usage. If you’re not running MySQL in a cluster, and in a smaller site I doubt you are, you can also remove the files used for the Binary Log, which is used to replicate MySQL to different servers, such as a redundant MySQL server. To do this, and something like this into your /etc/mysql/my.cf file. This should save you a lot of disk space as these log files can get huge over time.

    binlog_expire_logs_seconds = 68400 # 1 day in seconds. Choose a value that fits your usage.

    Can you think of any other tips for a smaller site? Just let me know in the comments.

  • How to monitor Unifi equipment

    There’s been a lot of talk on the ‘net about monitoring Unifi equipment. Unifi is a brand of prosumer networking equipment from a company called Ubiquiti. If you’ve ever wanted “the good stuff” for your home or office network, make sure to have a look at them, but I digress.

    One of the drawbacks of Unifi equipment is that they don’t publish their SNMP MIBs, so if you’re trying to add a Unifi router, switch, access point, etc. into your monitoring system, you’re in for a lot of work as you poke about with “snmpwalk” and see what you find. But, if you run Zabbix as your monitoring system, you’re in luck. Zabbix makes this easy, as they do with many things.

    Let’s take the example of a Unifi switch, but this concept works for all of their networking devices I’ve tested.

    The trick in all of this is the Zabbix Template which does not come pre-installed. To install it you can download it here (for credit, visit the author’s GitHub repository) and unzip it. You’ll find an xml file in the zip, and you’ll want to import it into your Templates. To do this, go into your Templates under the Configuration menu, click on the Import button and follow the directions.


    Once you’ve imported the Template, it will be available to add to a Host in Zabbix.

    Finally, to monitor the switch, create a Host which looks something like this in the image below. Note I’ve added the “UbiquityAirOS SNMP” Template. I’ve also added an Interface that points to the switch’s network address as SNMP. Since a Zabbix Agent can’t run on a switch, I’ve just used the network address as an SNMP device, so it doesn’t show any errors when looking for a missing Agent. Indeed, Unifi switches are SNMP enabled, so talking on that port won’t produce an error.

    Once you’ve created the Host, assigned the correct networking address as SNMP, and added the Template, just wait for the Template to do its magic. Be patient, as it may take a few minutes to sniff out the switch and its settings. When it does, you’ll see lots of Items created and Triggers to go with those Items, meaning you should have to do very little from here on out.

    Once the Items start to appear, you can look in the Latest Data menu item under Monitoring and select your switch’s Host. You’ll see lots of data appear that looks a little like the image below. Of course, depending on the model of your switch, different things will be monitored and thus shown in your Zabbix as Latest Data.

    Now that it’s up and running a few things to note.

    1. You may get notices of links (often called a “port”) in the switch going offline sometimes. These are not active ports, but perhaps a port that’s not currently in use, and Zabbix discovered this and alerted you. The first time this is a little alarming, but you soon realize that these ports are not in use, and you can disable them if you’d like.
    2. If you upgrade the Unifi device and use the same network address, you’ll get a whole new set of data in Zabbix that will mix with the old data. This mixing is probably confusing, so I’d recommend clicking on the “Unlink and Clear” link near the Template, and then adding the Template back into Zabbix. This will clear out the old data and only have the new data showing up.
  • How to get the “up(1)” to show for a Item’s status value.

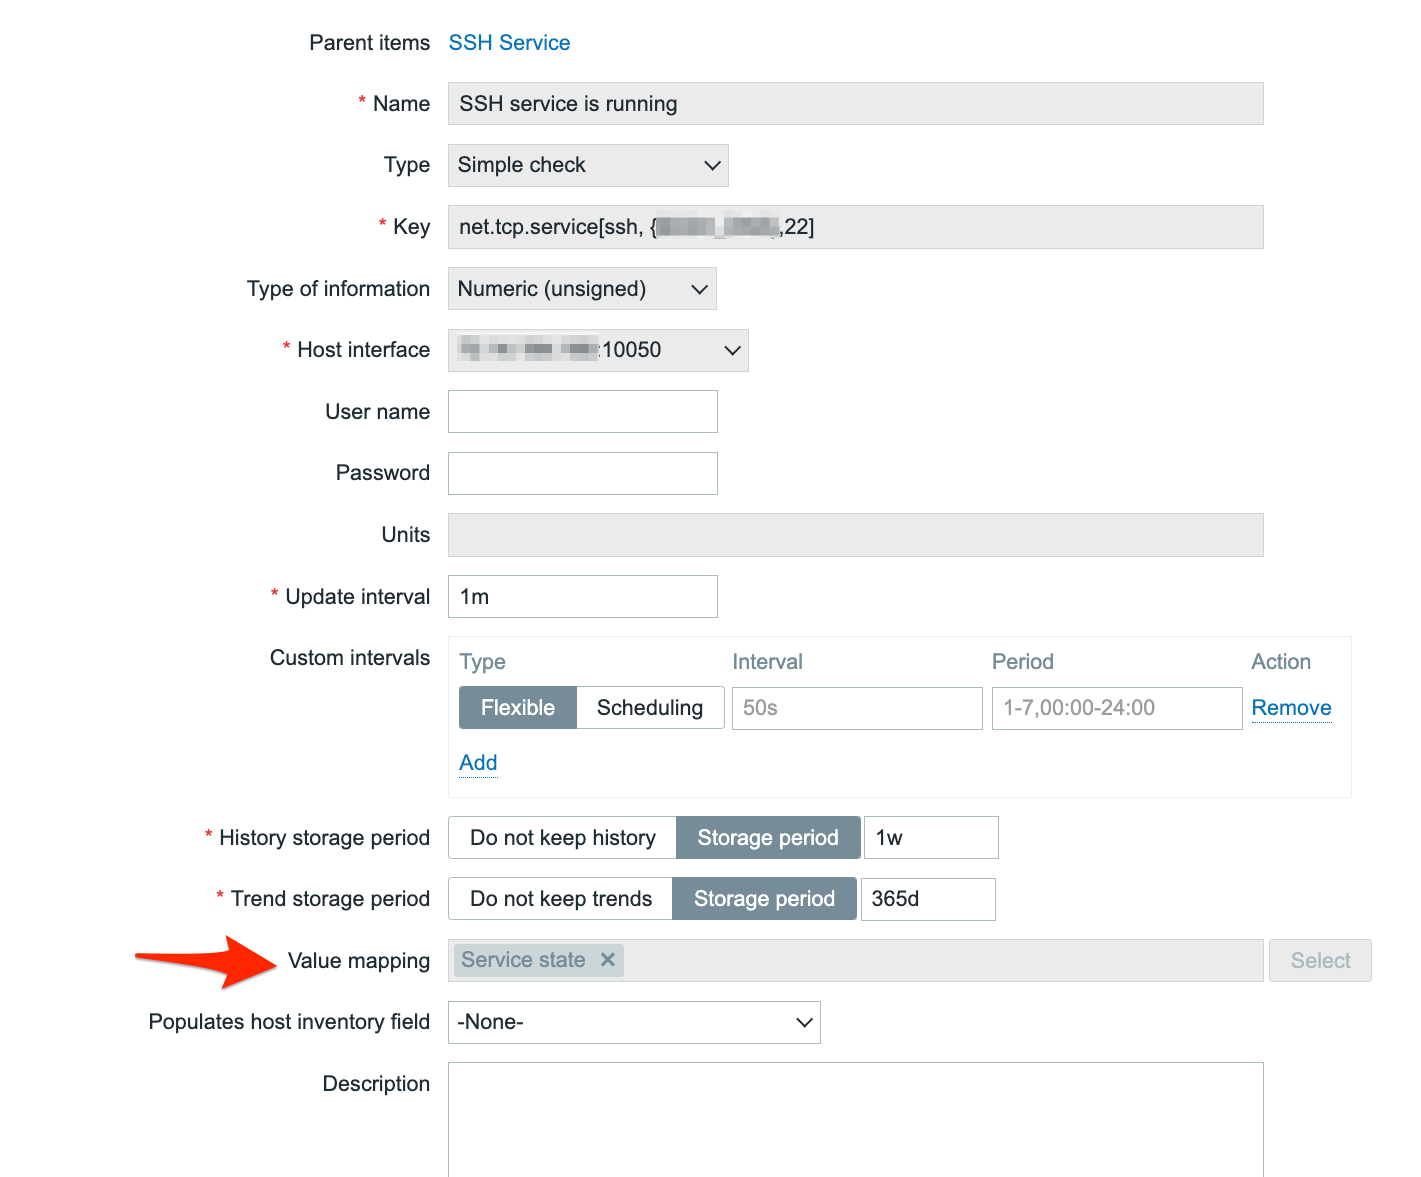
    In Zabbix, when you poll an Item for a Host, you sometimes get back a numeric “1” (one) or “0” (zero), but you’d like to display it in English. as an Up or Down value. You’ll typically see this when you poll a Service on a Host, such as SSH or HTTPS. 

    When defining the Item to check, look for the “Value Mapping” field noted by the red arrow in this Template. Simply select the entry Service State, and then update the Item. When the Item next gets data, often every minute, the new value will look like “up (1)” or “down (0)”. 

    Remember, this is just aesthetics. The value stored is still “1” or “0” as a numeric, but now it’s presented in a more human-readable format.

    If you don’t have the Value Map defined, do it under your Template.
     

    Once the Value Mapping is done, add this to the rest of the Template, and then assign the Template to an Item. Note the selection of the Value Mapping below.

  • What You’ll Find Here

    I’ve been in Tech since punchcards were a thing, and throughout that time, I’ve benefited from the knowledge of others in the industry. This site will house the tips and tricks I’ve learned over the years, representing my attempt to give back.

    Information on this site is correct to the best of my knowledge. I may help you, or it may be useless to you. Regardless, you may use it as you will, without holding me liable for its contents affecting your systems, business, or person.